Categories
UI UX

Testing the Logic of your Information Architecture Design

The following post references a web application for testing the logic behind a website’s information structure. The app can be accessed here, and can be tinkered with here. 

Perhaps one of the most daunting tasks when tackling a large-scale web design projects is figuring out how to organize the website’s content in such a way that it becomes intuitive for the “average” (if that even exists) user to navigate. Despite its apparent simplicity, this is a very challenging design process that requires shedding all biases and thinking as objectively as possible with the hopes of arriving at a semi-logical information architecture anyone can navigate through with ease.

via GIPHY

I’m currently involved in a restructuring of a large Human Resources website for the organization I work for, the Inter-American Development Bank. The project came about because year after year, as new content was added and created, the current structure was not flexible nor scalable enough to accommodate the new content, which resulted in some information being buried, often many levels deep, without clear indication of where to find it. Sometimes even I, the person who is now in charge of updating the website, have trouble finding certain pages and bits of information.

This time, we wanted to get it right. We want to create an information architecture that is highly user-centered– that is, a structure that accommodates to the end goals of our target audience. In no way did we want this structure to reflect how the Human Resources department is internally organized. Rather, end-user motives and needs framed as use cases shaped the way we allocated the content pages within the hierarchy.

Solution

As expected, coming up with a solution was a highly iterative task that involved many people — from our small team, to various HR subject matter experts, to managers. Though the structure itself has not been approved as of the writing of this post, we did arrive at a core design characterized by a simple 3-tier hierarchy:

  1. The first level provides the highest level of abstraction and each item in the menu represents a core HR area. In other words each top-level menu item corresponds to something HR does in a very general sense.
  2. The second level is the bridge that connects the high-level core HR areas with the actual pages of content.
  3. The third level is the webpage level and may further decompose into page subsections.

Testing the solution

Though the latest version of the solution has been agreed upon, it would be ill-advised to implement and deploy it in production if it hasn’t been tested. Given the limited resources we have in terms of time we couldn’t schedule “focus groups” nor complex testing environments, which is why I decided to create a simple web application that utilizes click count as the metric to evaluate the integrity of our proposed structure.

Screen Shot 2016-08-19 at 11.57.15 AM


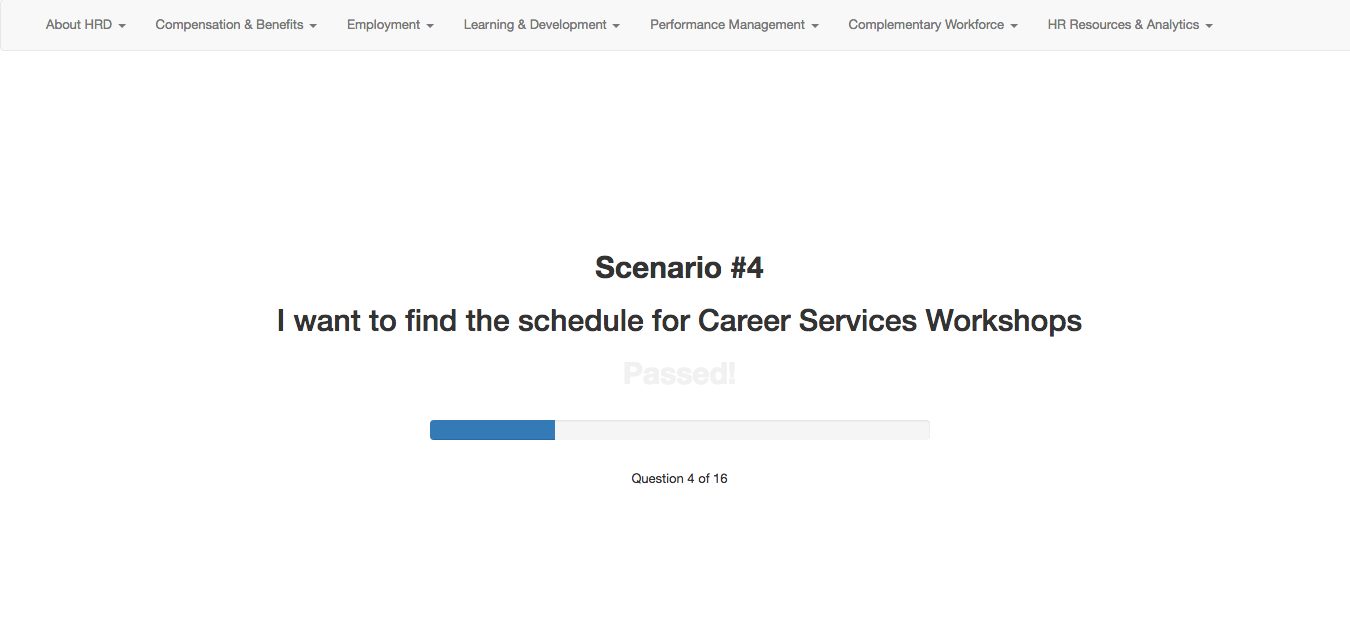
The application is essentially a quiz app that presents the test-taker with use case scenarios. For instance, “I am an employee looking for a Career Development workshop”. After reading this use case the test-taker must utilize the navigation menu bar at the top to find the child-level page where he/she thinks the content related to the use-case is located. More than anything, this test measures the efficacy of the top-level navigation links, as those are the ones with higher abstraction and the ones that group and categorize the content of the information structure at all levels in the tree,  often making them the harder ones to get right.

As the test-taker clicks around and “digs” for the right link, the application counts the number of clicks needed to fulfill and solve the current use-case/scenario. Ideally, and because the top-level links do not expose its children links on hover, the user should take between 2-3 clicks to find the right link. Anything above 4 clicks is worth reconsidering, and anything that takes above 5 clicks to find must be rearranged.

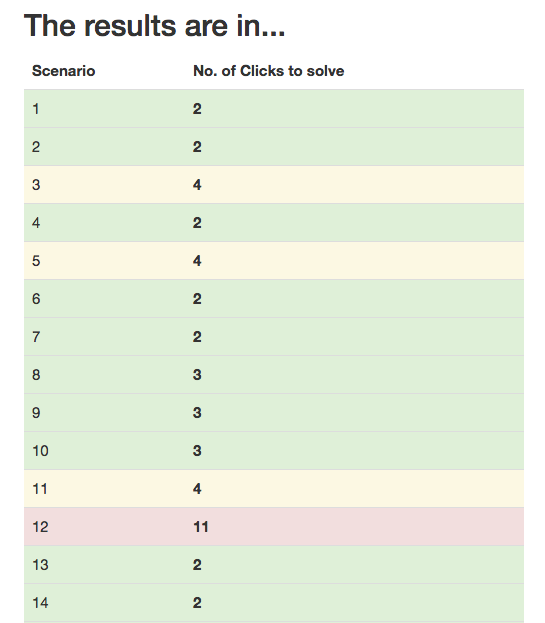
To help us with this analysis, at the end of the test, the application generates a color coded “Report Card” which lists each scenario and the number of clicks it took to solve the given use-case. Based on the scale I mentioned in the previous paragraph, each row is colored so that we can easily determine the use cases that were difficult to complete due to the current navigation structure.

Screen Shot 2016-08-19 at 12.10.49 PM
This mock report shows how most use case scenarios can be easily solved with the current navigation structure. Scenario #12 however (red) shows we ought to make an adjustment.


This application is hosted on codepen.io so its code is open source by default. If you have a website structure that needs quick user testing you may fork the pen and modify it as you must. It has a jQuery and Bootstrap dependency but can easily be modified to use vanilla JavaScript if need be.

Categories
Design

The Type is Worth It

I’m the type of web developer who appreciates good type on screen. I mean, just think about it. Typography is such a mysterious design tool. Designers spend substantial time deciding on the right family, the right em size, the right kerning, the right leading, the right weight, etc. And yet, despite the effort and thoughtful decisions backing a well designed web page, most readers do not internalize the visual vernacular being transmitted through typography in every single heading and paragraph. Type, in a weird philosophical way, is visibly invisible.

Even though I think typography is crucial to good design, I must also admit that I, too, forget to consciously appreciate typographic decisions most of the time. Being part of the fast-consumption paradigm that rules the modern web has conditioned us to simply enjoy the hyperlinked nature of the internet; jumping from page to page we visit a site and a few seconds (or minutes) later we’re gone. Users (including myself) do not pause to admire ligatures and font contrast. They, we, just want to read– and fast.

https://flic.kr/p/q2RzMU

Categories
JavaScript

Performant, Interactive SVG visualizations with Session Storage and D3 js

Lately I’ve been working on Mars.io, a personal project that brings Martian weather analytics, down to Earth (ha!). Puns aside, In the application users can analyze weather data sent by the Curiosity Mars Rover’s REMS (Rover Environmental Monitoring Station). The app does this by fetching the data in JSONp format from the MAAS API, which is then output and graphed on an SVG line chart with the help of the D3js data visualization framework.

There is one component in the application, however, that was worrying me as I was developing it, namely the interactive SVG line chart. This chart plots historical martian temperature data sets. Here’s a screenshot of the component:

Screen Shot 2015-02-27 at 2.42.44 PM

The first thing you’ll notice, is that Mars is a very, very, very cold place, and that those people who are fighting to move there are completely insane.  The next thing you might notice is the range input slider at the bottom which controls the output of the graph through time.

Here’s how the component works (in English):

The app listens for the OnChange event from the input slider, which triggers a method that takes the current value of the slider as input to concatenate the right URL (with query string parameters) that fetches the JSONP data from the API (the request is done with jQuery’s $.AJAX helper method ). On success a callback function is triggered that processes the data received, stores it in two distinct arrays (one for celsius data, and one for fahrenheit). Milliseconds later, when the request is complete, a callback function is called which triggers the method that plots the graph with D3 in the right temperature unit using the Arrays populated after the successful request.

The problem

The problem is that the data that makes the app useful lives in a server somewhere. This means that the somewhat elaborate process described above could potentially happen over 47 times! The API has 470+ individual weather reports, which are sent in batches of 10. Each time the input slider is moved, it requests a batch of reports from the web server. A user then could want to view all 47 sets, thus making 47 requests.

Furthermore, the codebase (as it was coded initially) introduced redundant requests: if the user slid back in time, then forward, the application would make a request for data it already had just moments before!

This was inefficient and not performant at all (despite the almost negligible 4Kb of data coming through the pipes). As a developer I can’t guess what set of data the user wants to see, nor can I limit the amount of data the user has access to. What I can do, is limit the number of redundant requests.

Solution: Session Storage

With the web session storage API, I could now store all the data being requested in the browser for the length of the session. A browsing session means that the data is stored even if the user reloads the page, or goes to another page within the same domain.

Now if the user wants to move forward from past to more recent data, the method that draws the chart can use the data already stored in the browser, rather than making a redundant API call.

How it works

I won’t go over the web storage API in its entirety, but I’ll explain the basics. Web storage essentially lets you store data in a hash-table-like structure that is implemented locally in your user’s browser. To populate the storage you simply push items to the table with a Key for future retrieval.

The two methods that interest us are setItem() and getItem()

// store some data
window.sessionStorage.setItem("someKey", 33);

// retrieve the data
console.log(window.sessionStorage.getItem("someKey")); // returns 33

Really simple. In my app’s case though I needed to store full JSON objects. In order to store these, it is common practice to store an individual object as a string, and whenever you need to work with them, you parse them back to JSON.

The function getDataSet() below demonstrates the setting of JSON data. This function is called in my app whenever an API call is made for the first time. The function is passed in a data parameter which is the JSON data returned by the API. The function iterates over the object with jQuery’s $.each, then creates two object literals for each temperature, pushes those objects to arrays (thus creating new JSON objects) that will be used to chart the graph the first time. The same objects are also Stringified, and set to session storage in case the user wants to draw the same chart in the future.

function getDataSet (data) {
			
  console.log("JSONP REQUEST COMPLETE");
			
  $.each(data.results, function(index, value) {
				
	
	var	celsiusTemps = {
		date: value.terrestrial_date,
		min_temp: value.min_temp,
		max_temp: value.max_temp
					};
					
	var	fahrenheitTemps = {
		 date: value.terrestrial_date,
		 min_temp: value.min_temp_fahrenheit,
		 max_temp: value.max_temp_fahrenheit	
					};		
		
				
	//push objects to the appropriate array for immediate graphing
	celsiusTemperatureArchive.push(celsiusTemps);
        fahrenheitTemperatureArchive.push(fahrenheitTemps);


});
	
 // store each data set in session storage to avoid multiple API calls in the future
 window.sessionStorage.setItem(archivePage + "c", JSON.stringify(celsiusTemperatureArchive));
 window.sessionStorage.setItem(archivePage + "f", JSON.stringify(fahrenheitTemperatureArchive));

}

Note that I’m creating the Key of the session storage dynamically by concatenating the “Archive Page” number (which, remember, can range from 1 to 47) with the unit symbol ( I need this in my app so that D3 knows what unit scale to use when graphing the chart ).

In Chrome dev tools you can check whether the session storage worked:

Screen Shot 2015-02-27 at 8.30.51 PM

Ignore the latestReport Key. That one is set as soon the app is loaded for another temperature UI module. But you can see the session storage worked! I now have the data cached locally ready to go. If I want to graph the latest 10 data reports 50 times It won’t make 50 requests to a remote server, because we already have the data. But wait? Will it? Not yet. I haven’t written the code for the app to decide what data to use under which circumstances.

What I need to do is tell the app to make a request If and only if the data is not stored already. In my application, I do this by using the value of the “archive page” generated dynamically by the value of the input slider, and use it to check if when used as a key, a value is returned. If null is returned, it means that particular data set has not been stored and thus we execute the AJAX call. Else, we use the stored data to graph it.

// if the data is not in the session storage, fetch it
if(window.sessionStorage.getItem(archivePageKey) == null) {
		
  console.log("loading archive " + archivePage + " from API..." );
			
  /* GET JSONP FROM API
  ============================*/
  $.ajax({

  url: archiveUrl,

  // The name of the callback parameter, as specified by the YQL service
  jsonp: "callback",

  // Tell jQuery we're expecting JSONP
  dataType: "jsonp",

  // Work with the response
  success: getDataSet,

  // chart the response once we obtain the data
  complete: function () {

	drawChart(unitToChart); // draw chart in the right unit

	// show chart label and input control
	$('#graph-ui').show();

}
	}); // end AJAX
		
} else {
		
	console.log("using stored data...");
	drawChart(unitToChart, true, archivePageKey);
				
	// show chart label and input control
	$('#graph-ui').show();
		}

You don’t need to concern yourself with the name and parameters of my functions. All I want you to take away from this is how to use session storage API to conditionally load the right data.

We will take a closer look at the a section of the drawChart() method however, as it contains some crucial conditional logic that takes care of initializing the right data set for D3 to draw, which is stored in the variable appropriately named data.

The method takes 3 parameters. The first one is obligatory: a string “f” or “c” that tells the method what kind of data set to use, either celsius or fahrenheit. Then a boolean value is passed. If true, it tells the method to used the data we cached in session storage, and the third value is the session storage key that is dynamically generated on each input slider event so that the data set can be retrieved.

Remember that in order to use the stored data, it needs to be parsed back to JSON using JSON.parse(), otherwise we’re working with a string that has no computational value… and things will break.

function drawChart(tempUnit, loadCached, archiveKey) {
	
  // clean the node before appending SVG
  document.getElementById("temp-graph").innerHTML = "";

  // Choose the right data set
  if(loadCached) 
  {
     var data = JSON.parse(sessionStorage.getItem(archiveKey));
  }	
  else 
  {
    // choose data set according to temperature Unit passed
    switch( tempUnit) {
    case "f":
	var data = fahrenheitTemperatureArchive;
	break;

    case "c":
	var data = celsiusTemperatureArchive;
     }
  }

/*---- SVG D3 DRAWING CODE GOES BELOW  -----------*/

Once one of the 4 possible data sets is determined, D3 does its thing rather wonderfully. There you have it! An interactive chart that uses data more efficiently by reducing the number of potential HTTP requests!


Categories
JavaScript Uncategorized

JavaScript Patterns in Object Oriented Programming and Inheritance

When I first started learning JavaScript, I would challenge myself by reading source code I would find at Github from some open-source repo. Other times, I would just view > source a website and look under the hood. This, I thought, would verify that I was indeed understanding the theory and concepts I learned from books. Often, however, these autodidactic activities resulted in my spirits crushed as I encountered code blocks that were too convoluted and elaborate; code that would use all those little building blocks of the language (logical operators, keywords, variable scope, etc) together in order to build a complex architecture I was completely ignorant of and intimidated by. In short, I would just run into code that was well beyond my limited comprehension.

One thing I did notice was that there was a lot of similarities between code blocks. Which meant there was probably a fairly standardized, conventional pattern being used.  Lately, I’ve finally got a chance to be introduced to these patterns thanks to my current university class. And so I though’t it’d be beneficial to share some of these pervasive patterns that you’ll likely find at some point in your journey as a JavaScript developer. So without further ado, let’s get to it.

Categories
Personal

Let the Right of Passage Begin

Let me begin by saying that this post will be short from monumental or revolutionary. Frankly it’s more about having something on the blog than anything else, but I guess I can take this opportunity to touch on why, after so many self-imposed, inexcusable delays, I am ready to begin my blogging venture: