Overview
IDB Invest, an international organization focused on providing financial products and services to increase sustainable development in Latin America and the Caribbean. Towards the end of 2020, and after an extensive external audit by a marketing agency, the organization had validation for something was evident: the current website was not serving it’s strategic purpose.
There were a few key areas to focus my efforts in the redesign, and they both were related to the user journey and user experience (UX). I wanted to improve and optimize the UX in terms of page-load time to reduce the bounce rate of our site visitors, help conversion rates, and provide an experience more aligned with IDB Invest’s brand values.
On the user journey side, I wanted the home page to be a strategic business tool where we could provide a series of touch-points in the web experience that would not only showcase the different communication/marketing products (publications, blog posts, etc.), but also facilitate conversion, thus moving our users down our “engagement funnel”.
Objective
Problem Domain: How might we improve the UX of the current home page so that it increases user engagement and helps IDB Invest be more intentional and strategic in its marketing objectives?
Users and audience
After some research, the audience/user categories were broken down into the following 4 groups:
Potential Clients/Leads
This audience segment is one of the most important ones as they fuel the growth and the impact of IDB Invest. Without clients, the mission is null. Our content strategy for this audience leverages inspirational and descriptive content in order to evidence the organization’s expertise, it’s value proposition, and build trust.
Civil society
This audience segment represents the people, the main stakeholders of the Latin America and Caribbean region who are directly impacted in the development work IDB Invest funds. For this audience, I thought it would be important to emphasize transparency in the content we showed, in order to build trust.
Press and media
This audience segment helps IDB Invest broadcast its mission and purpose, as well as keep accountability on IDB Invest’s transparency. Again, emphasizing transparency in the type of content we would develop was key in order to keep this audience engaged.
Investors
Much like the client/lead segment, this audience buys helps IDB Invest amplify its impact by funding bonds in capital markets. One of the main reasons this audience engages with the organization is because of low financial risk and the positive development impact that their money funds. To motivate this audience, I focused on including content/components that would allow us to inspire them and motivate them to engage with the organization.
Website content editors
The final audience or user segment to be considered was within the organization. Website content editors work everyday in creating fresh content (blogs, press releases, publications, project updates) that maps perfectly to the content needs of the audiences described above. Designing a way to show a feed of these content updates in an automatic and decentralized way was important in this project.
A note on user segments and technology
Even though the core of our users visit us on a desktop computer, mobile traffic increased 198% in the past year, with most of it coming from our main stakeholder region: Latin America and the Caribbean (LAC).
33% of traffic (1 out of 3 users) visits the website on a mobile phone. And out of that third in our traffic, 77% comes from a user in the LAC region.
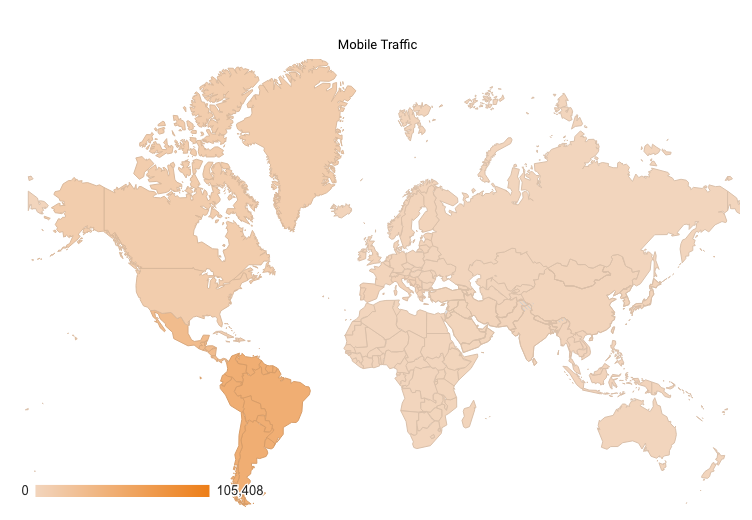
I leveraged this data while crafting the UX and page-speed Optimization strategy. Because mobile traffic is growing– and expected to grow as mobile devices become more affordable in emerging markets– special care was put in ensuring the mobile user experience had great usability and in making sure the data footprint of the home page was low so that the page becomes faster to download.
Design process
- Define and design components that increase engagement for defined audiences
- Define a speed optimization strategy to provide a better UX and decrease bouncerate sessions.
- Test optimization strategy.
Outcomes
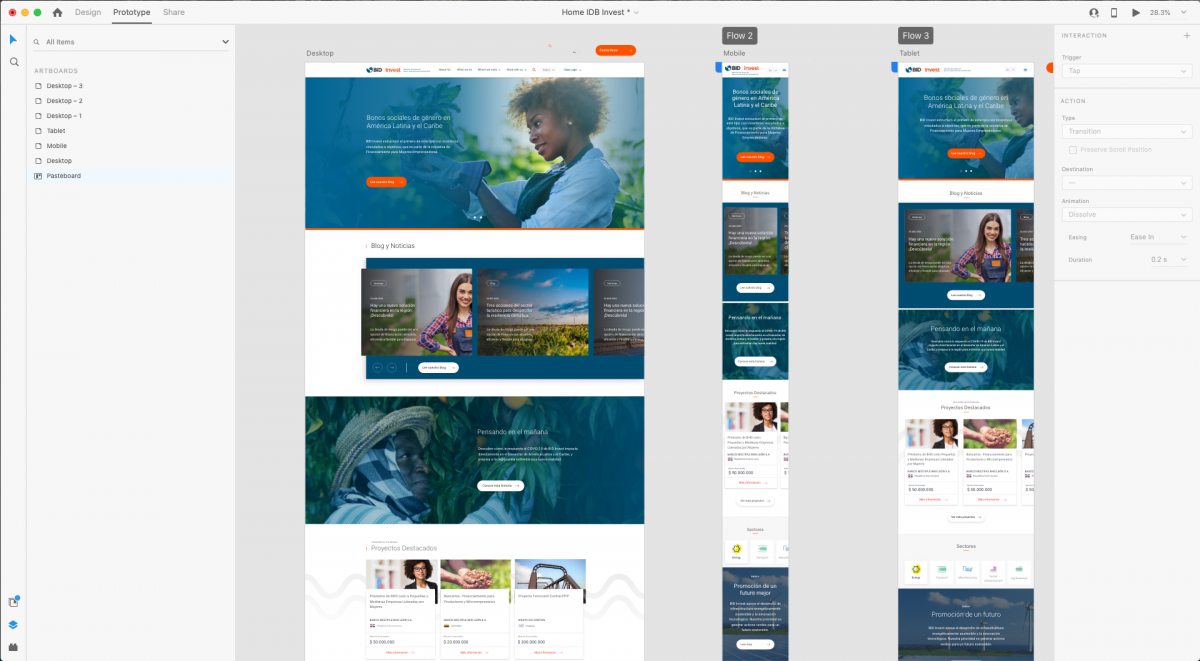
Redesigned home page components– restructured for increased engagement.
At the content level, one of the main shortcomings of our website is its lack of a clear, strategic user experience where we can funnel our users to engage with us in more active and less passive ways.
Thus I restructured and redesigne sections in the home page experience to attract and motivate our audience to engage with us actively (subscribe to newsletter, contact sector experts, visit our blog or publications, etc.)
The home page now has dynamic components that update automatically to accommodate our suite of communication products (Blog posts, news, highlights, latest publications, sector information, etc.) whenever a website editor publishes or pushes a an update.
With this restructuring we hope to lead our audience to our various content offerings, nudge them to engage with our products, and build an even stronger stakeholder relationship.
Load-time performance improved dramatically
Another concern that was raised by a personal audit was the lackluster User Experience of the current site due to its poor load time performance; specially in mobile networks (3G and 4G), where the average load time was found to be 8 seconds.
We decreased the home page’s data footprint from 7 Megabytes to just 2 Megabytes! This has made our home page 71% lighter with remarkable results: our home page is now perceived to be 55% faster than before.
Poor load-time performance affects our conversion rate (I.e., user engagement), increases the risk of user’s abandoning our website by 53%, and it might affect our ranking in Google search if left unchecked. To remediate this, I crafted an optimization strategy composed of 3 pillars:
- Automate the compression of images and other file assets,
- Standardize the use of lighter, next-generation image formats such as WebP, and
- Defer the download of assets (code, images, icons) until the user really has a need for them, via native Lazyloading.
This home page redesign allowed me to pilot this optimization strategy and gauge its potential in getting us to a successful outcome. I am happy to report that, because of this strategy, I was able to decrease the home page’s data footprint from 7 Megabytes to just 2 Megabytes! This has made our home page 71% lighter with remarkable results: our home page is now perceived to be 55% faster than before.
We will begin to apply this optimization strategy to other pages on our website, and we hope to reduce the average load time by more than half—from 8 to < 3 seconds—across the entire website experience.
Our homepage makes an impact in the region: it now costs 3.5x less for our users to visit us on mobile networks.
Although we do not charge users to access our homepage, the carriers that sell them mobile data plans do. Everything on the internet is composed of data that is downloaded, and our website is no exception. Now that we have reduced our data footprint by 71%, we have made our home page 3.5 times cheaper to visit on average.
This is an example of how we can use our digital presence to match our institutional brand and values. We often talk about the importance of spreading internet connectivity and closing the digital divide for development. With this home page (and the other pages that will come) we can say that we are indeed doing our part in making our website more accessible (faster and affordable) to users in emerging markets.
Cost of visiting IDB Invest Homepage on mobile networks before and after redesign
| Country | Cost per visit – Old Home page (7Mb) | Cost per visit – New Home page (2Mb) |
|---|---|---|
| Brazil | $0.59 USD | $0.17 USD |
| Mexico | $0.21 USD | $0.06 USD |
| Colombia | $0.15 USD | $0.05 USD |